Graphs #1: An Introduction

You've probably heard of graphs or Graph Theory at some point in your life. But do you know what graphs are and what they are used for? In this article, we'll explore the basics of graphs, their components, and some practical applications to get you started on this fascinating topic.
What are Graphs?
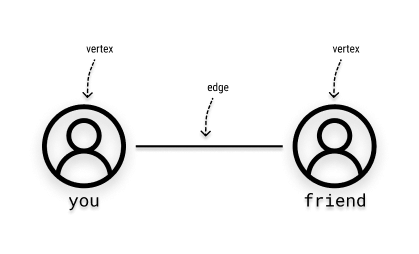
Simply put, we can understand a graph as a set of relationships or connections. How so? Think of a social network you use. Now think of a person connected to you through this social network. Representing this simple relationship using graphs, we have the following:

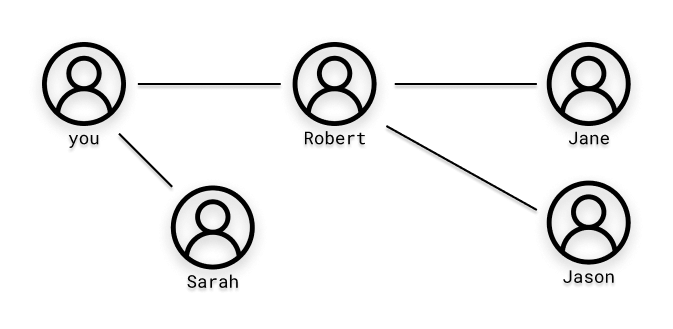
Now let's increase the complexity a bit and start considering not only your friends but also the friends of your friends, we can have something like this:
Components of Graphs
A graph is made up of points called vertices (or nodes) and lines connecting them called edges (or links). Think of vertices as the people, in the examples above, and edges as the friendships between them.
Now that we've explored what graphs are and the basic components that make them up—vertices and edges—let's delve into some real-world scenarios where graphs play a crucial role. By seeing how graphs are applied in various fields, we can better appreciate their power and versatility.
Practical Applications
Graphs are not just theoretical constructs; they have numerous practical applications. Let's now explore how graphs are used in everyday technology...
Airline Network
Imagine an airline wants to visualize the airports it operates in and the flights offered between these airports. Graphs to the rescue!
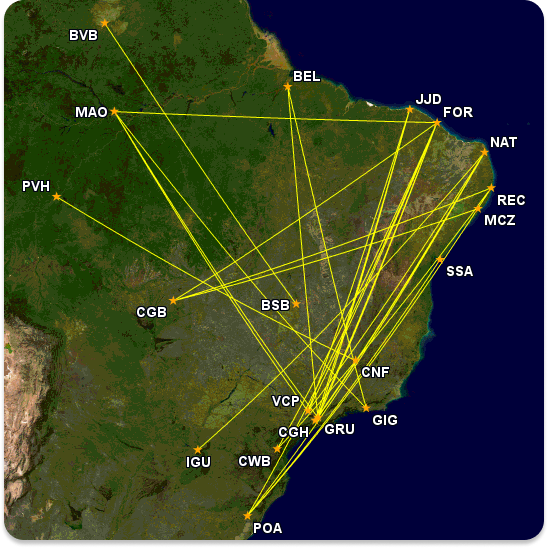
Going a bit further, when we look for flight tickets, it is often necessary to make connections at other airports along the way, as there might not be a direct route between the origin and the desired destination.
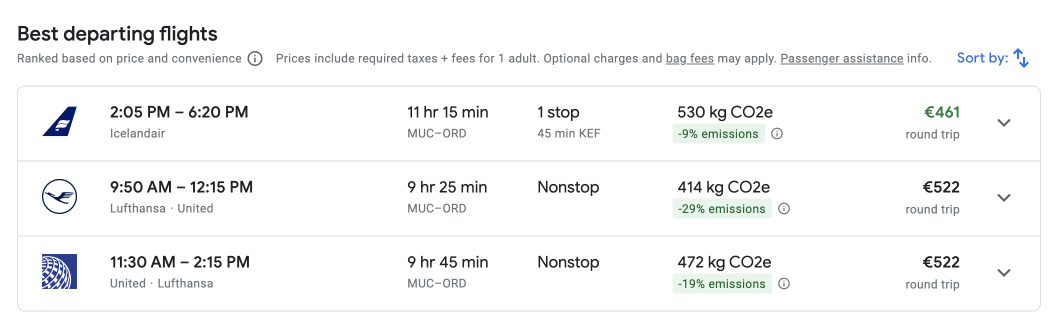
But how does the computer calculate the best route to travel from point A to point B? Graph algorithms like Dijkstra's Algorithm and A* Search help in finding the shortest path between two points on a map. These algorithms consider various factors such as distance, time, and price to provide the most efficient route.
Social Networks
How does LinkedIn calculate the "distance" between me and another member of the network?

See in the image below how LinkedIn connections can be represented using graphs.
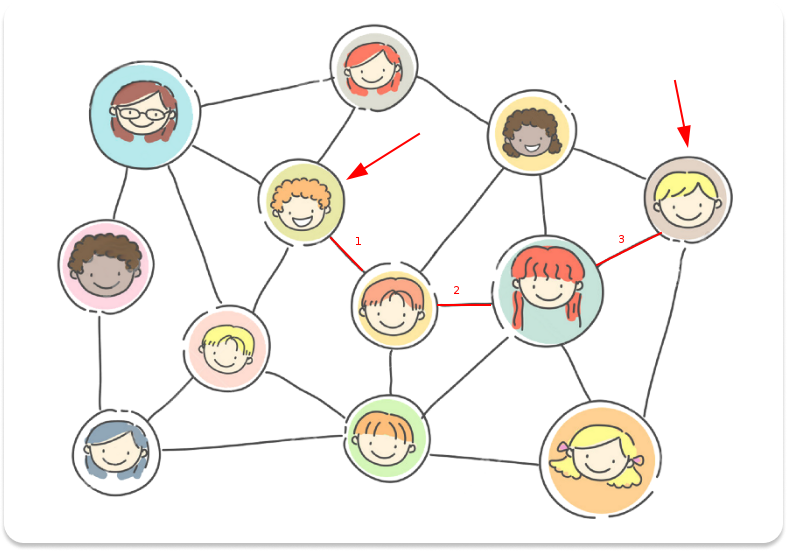
There is another search algorithm called Breadth-first search (BFS) that answers exactly this type of question. Notice that there are various other paths between the two of us. But I need to know the shortest path, or the minimum path. More on that in a future post. =)
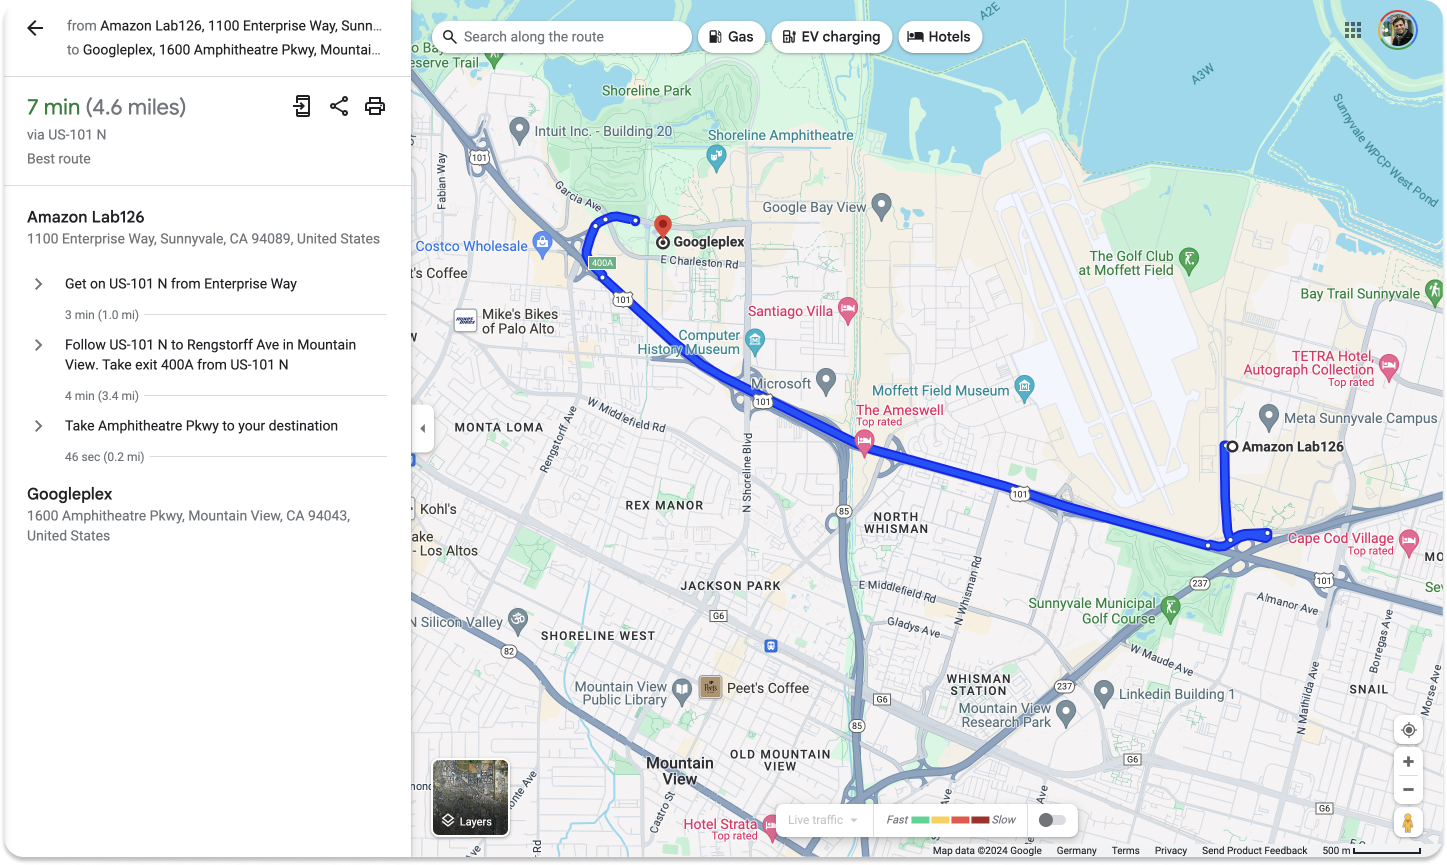
Global Positioning System (GPS)
How does Google Maps find routes between two locations? Again, using graph algorithms!
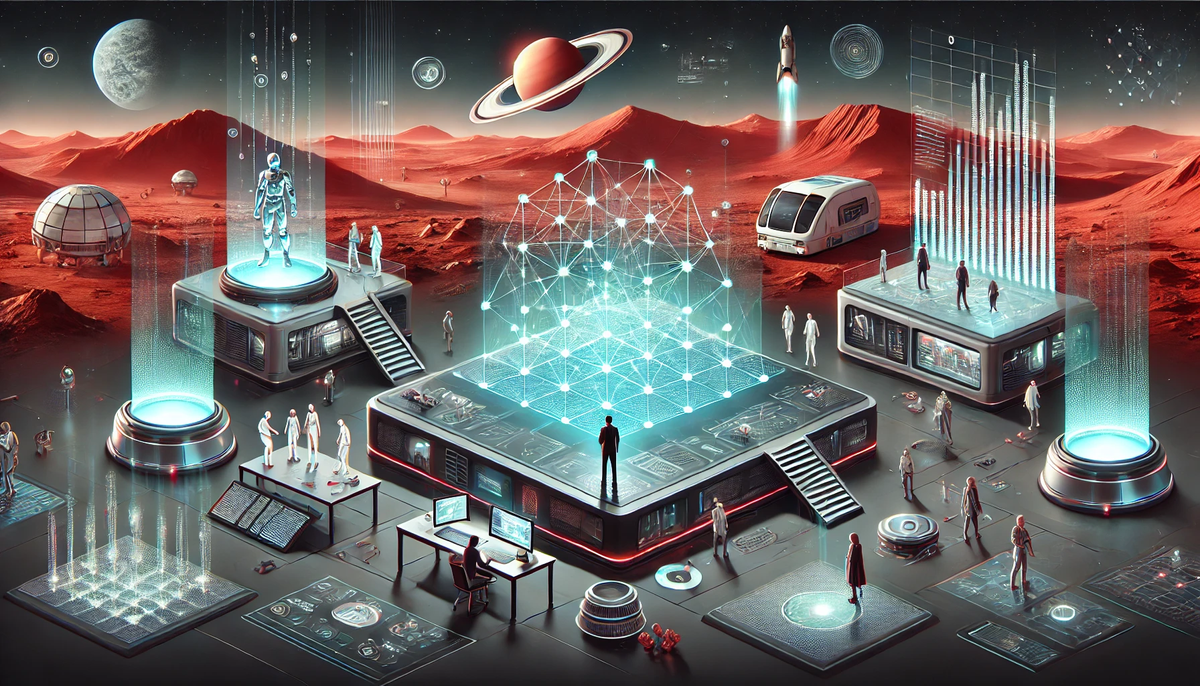
Knowledge Graphs
Knowledge graphs are essential for technologies that power Large Language Models (LLMs) like ChatGPT, search engines like Google, and virtual assistants such as Apple's Siri and Amazon's Alexa.
These graphs create a network of interconnected information, enabling these models to understand the context and relationships between different concepts.
Recommendation Systems
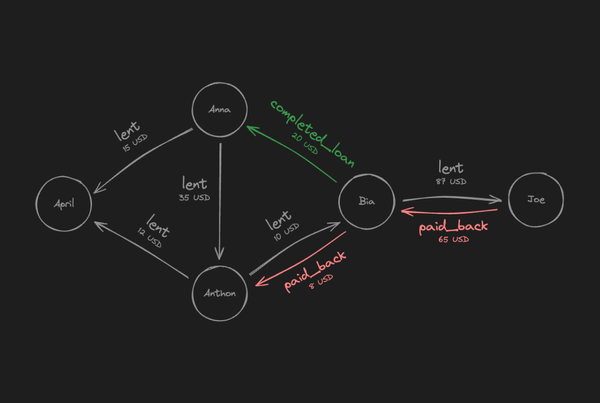
On Amazon, when you click on a book author, there's a section called "Customers also bought items by" that displays other authors.

This recommendation system uses graph algorithms to analyze customer behavior and suggest related products. The graph represents relationships between various items based on customer interactions, enabling Amazon to provide personalized recommendations.
Implementation in Code
So far, I hope it is clear that graphs are used to solve a variety of everyday problems. But how do I implement a graph in a programming language? The two most common ways to implement them are using:
- adjacency-lists, and
- adjacency-matrices.
Don't be intimidated by the names. Either method is quite straightforward to implement in code. Let's have a closer look:
Adjacency-lists
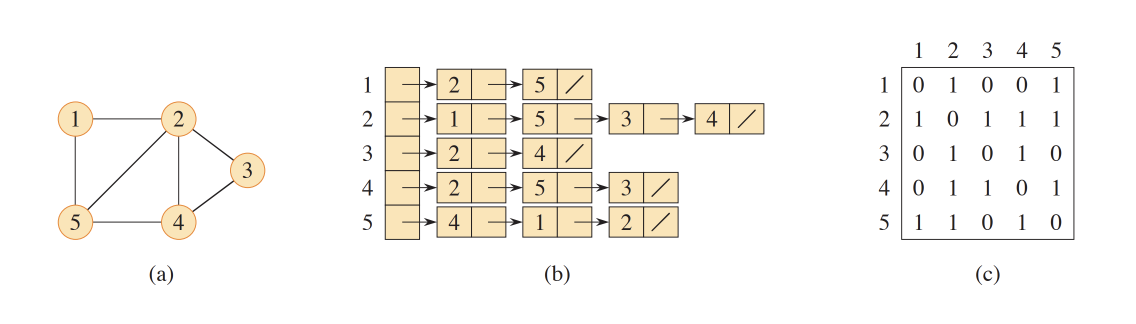
Adjacency refers to the concept of neighborhood in graph theory. In an adjacency- list, we represent a graph by listing each vertex along with its neighboring (connected) vertices. Looking at the image above (a), we see that vertex 1 has vertices 2 and 5 as its neighbors. Similarly, vertex 2 has vertices 1, 3, 4, and 5 as its neighbors, and so on. This representation is illustrated in image (b).
Let's see how this adjacency list would look in Python:
graph = {}
graph[1] = [2, 5]
graph[2] = [1, 3, 4, 5]
graph[3] = [2, 4]
graph[4] = [2, 3, 5]
graph[5] = [1, 2, 4]
Pretty easy, huh? We use a dictionary (hash table) where each key corresponds to a vertex and the value assigned to each key is a list of that vertex's neighbors, i.e., other vertices connected to it.
Adjacency-matrix
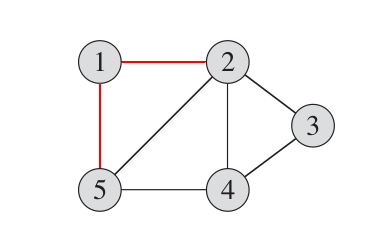
Here, the logic of indicating neighboring vertices remains, hence the name "adjacency matrix," but now instead of a list, we will use, guess what... a matrix. Looking at the image below, we see that our graph has 5 vertices: 1, 2, 3, 4, and 5. And vertex 1 has two edges connecting it to vertices 2 and 5.
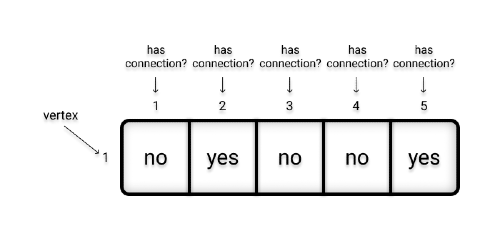
Modeling the relationship between vertex 1 and other vertices in this graph using an array, we have:
Applying the same logic to all vertices, we get the following matrix:
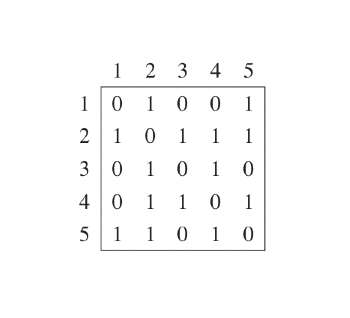
Based on all this, implementing a matrix in code is quite straightforward. Just use a two-dimensional array, i.e. arrays within an array. Like this:
graph = [
    [0, 1, 0, 0, 1],
    [1, 0, 1, 1, 1],
    [0, 1, 0, 1, 0],
    [0, 1, 1, 0, 1],
    [1, 1, 0, 1, 0]
]
You might be wondering:
And I would answer that you are right, for these types of graphs we have seen so far, which are quite simple, you can indeed use boolean values.
But imagine we are developing an algorithm to calculate routes for Google Maps and want to know how long it would take to go from one place to another or the distance between two locations.
In this case, instead of just indicating whether there is a connection between two vertices, we can assign a weight to this connection.
If you liked what you read so far and are curious about different types of graphs and how they work, check out my new article on different types of graphs. I'll dive deeper into weighted graphs, directed graphs, and much more.
References
[1] CORMEN, Thomas H. et al. Introduction to algorithms. 3rd ed. MIT press, 2009. ch. 22, p. 590.
[2] BHARGAVA, Aditya. Grokking Algorithms: An illustrated guide for programmers and other curious people. Manning Publications Co., 2016.